
Checks
Flood zone map and surface water flood risk
See the flood zone, the surface water flood risk and the main rivers around the red line, each with its source.
In short
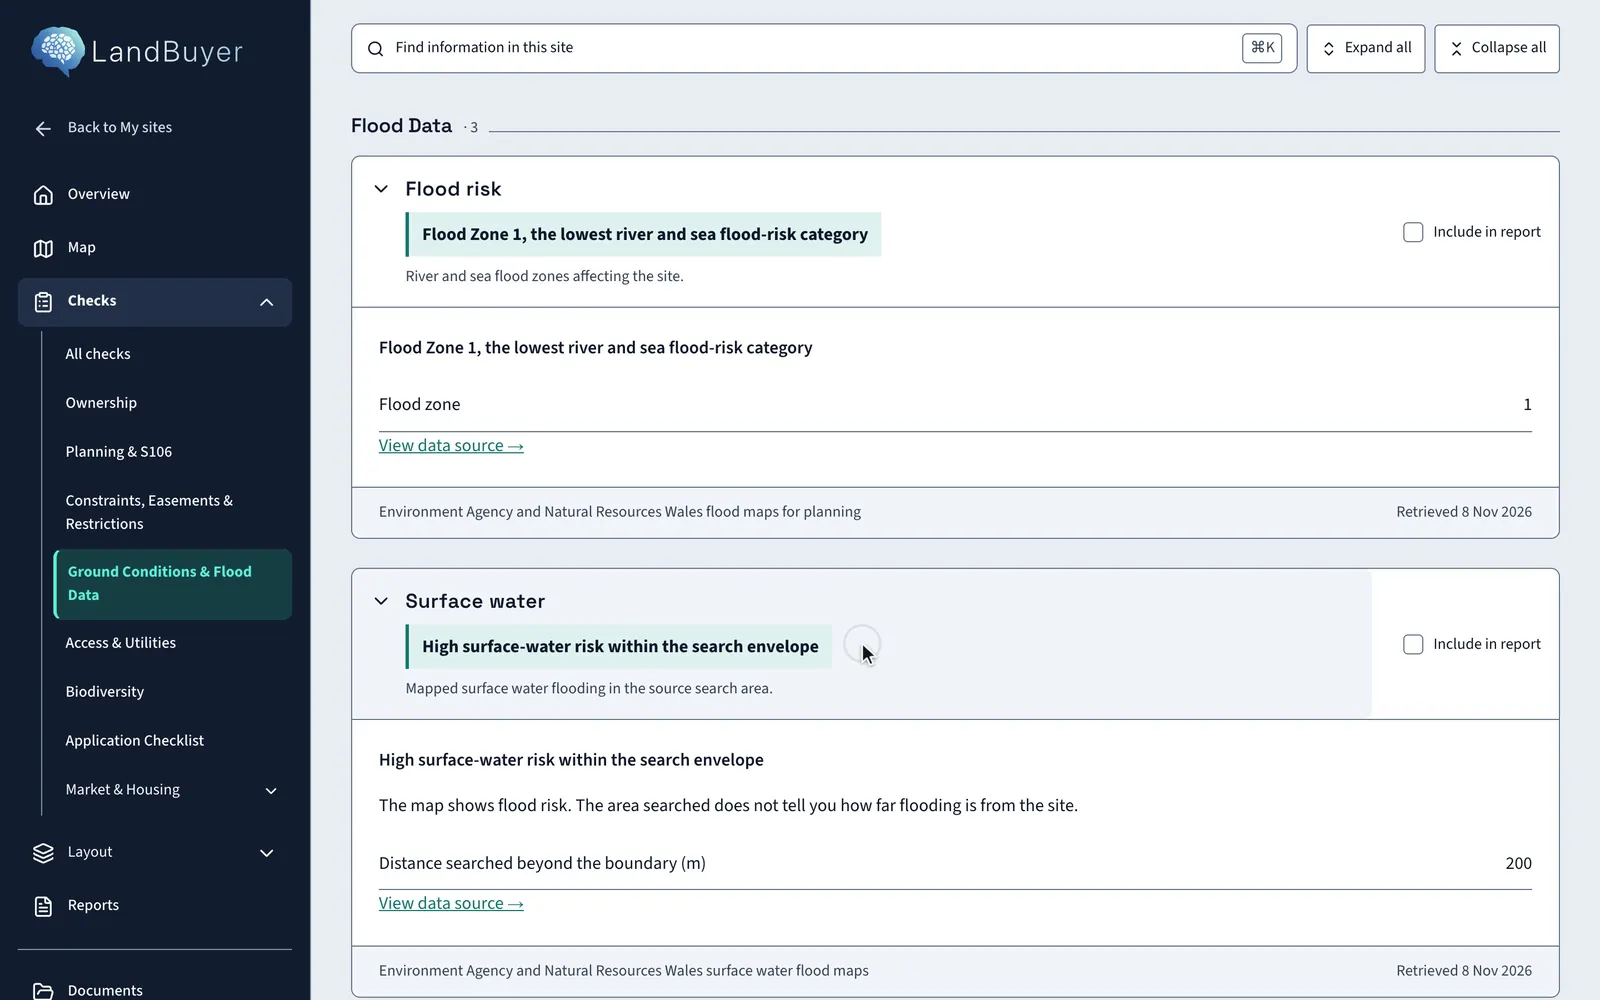
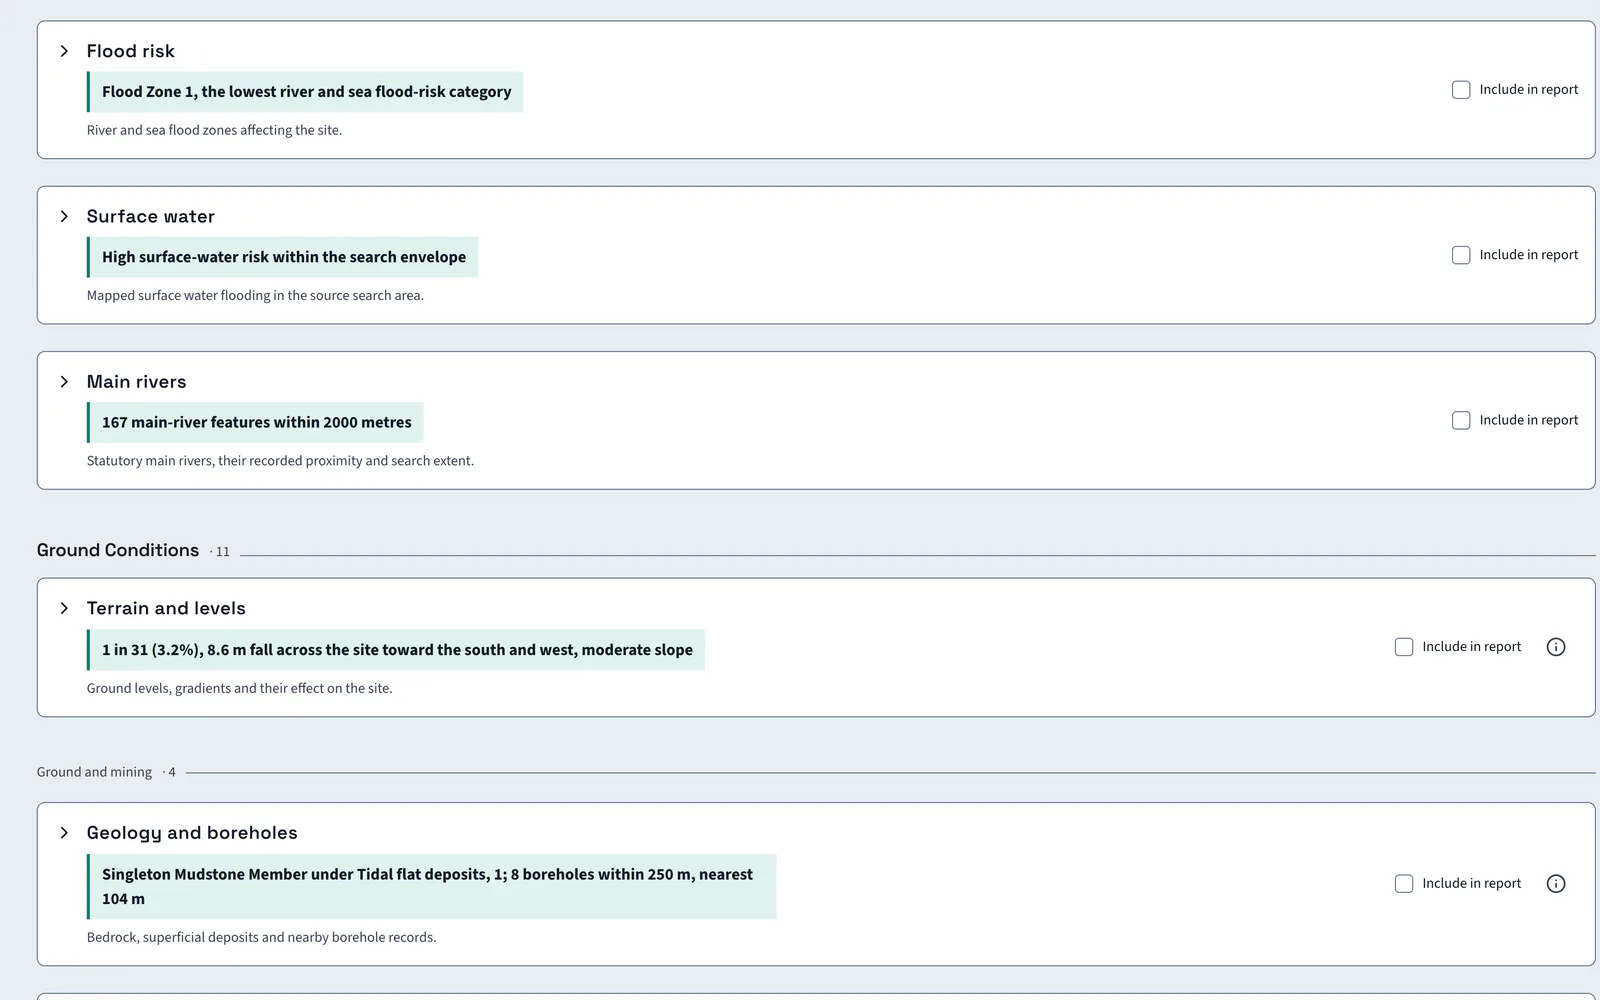
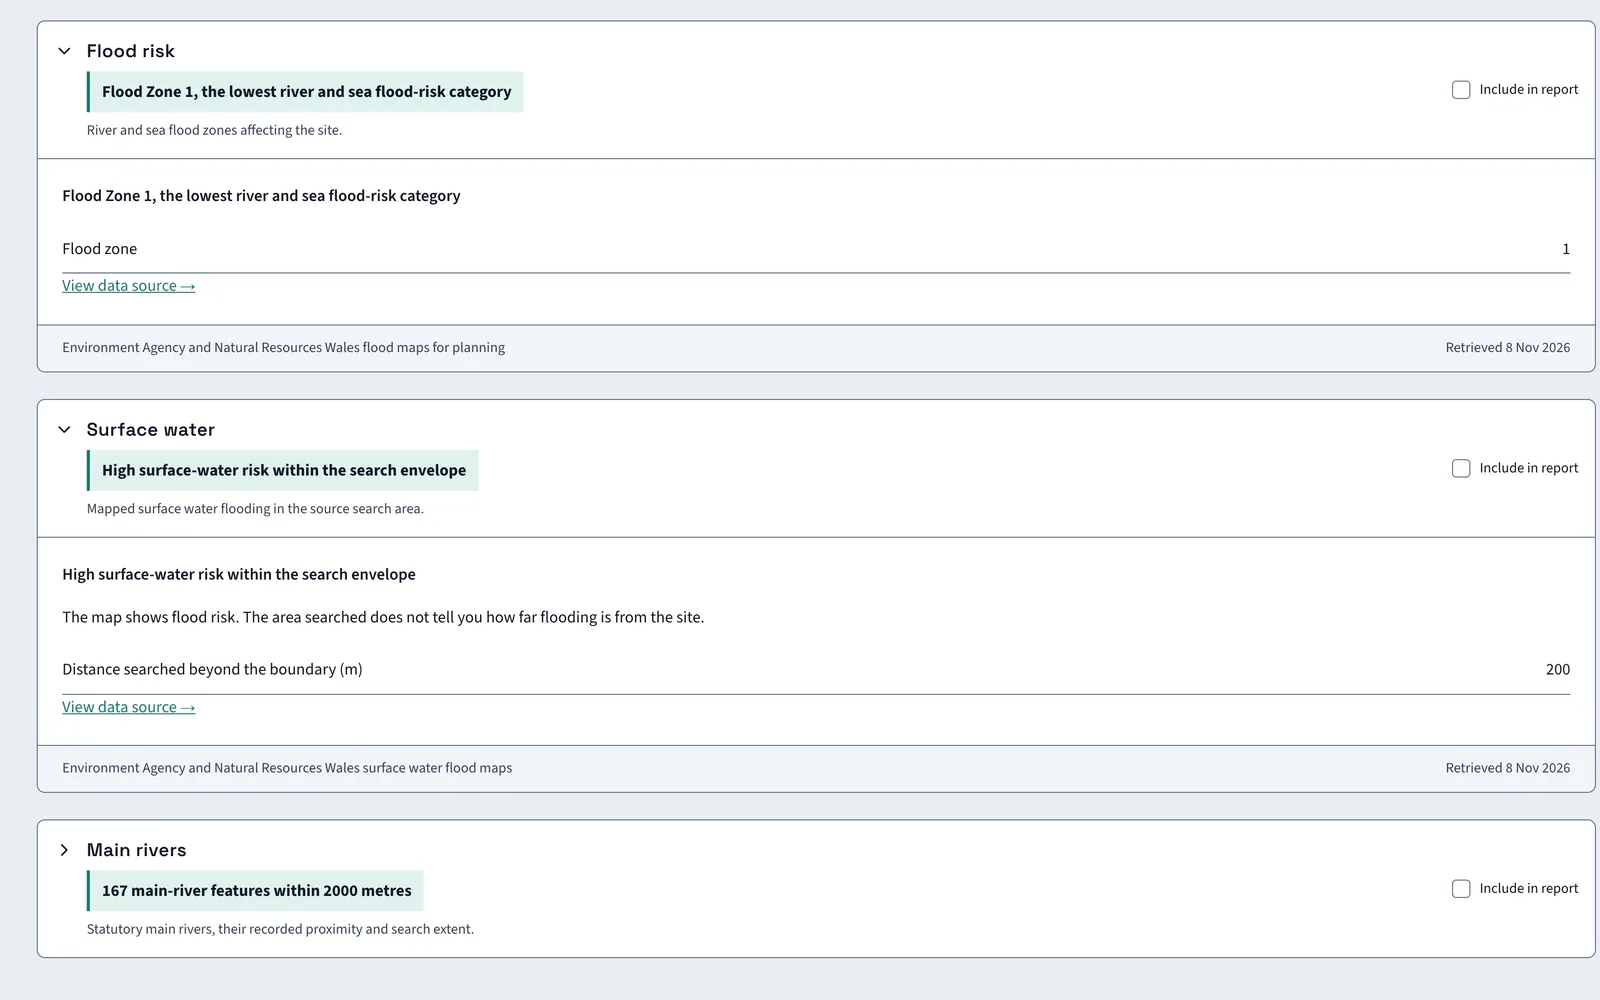
LandBuyer AI returns the river and sea flood zone for the red line from flood maps for planning, adds surface water flood risk and counts the main rivers nearby. Each card links to its data source. On Kew Yard the site is in Flood Zone 1, the lowest category, but surface water risk is high in the search area.
What it covers
What our flood risk check covers
| Item | Source type | What you see |
|---|---|---|
| Flood zone | Flood maps for planning | The river and sea flood zone for the site, 1, 2 or 3 |
| Zone 2 and 3 features | Flood maps for planning | The count of zone 2 and zone 3 features that touch the site |
| Surface water | Surface water flood risk maps | The risk level, high, medium or low, in the search area, with the feature counts by band |
| Main rivers | Statutory main river map | Main river features within 2,000 m of the site |
| Water bodies and watercourses | Mapped water features | Water bodies within 50 m, those at the boundary, and any riparian ownership question |
| Terrain and drainage | Terrain model | The fall across the site and its direction, which sets the drainage routes |
| Data source | Each card's source link | A link to the data source, with the dataset named under each card |
| Drainage consequences | AI reading of the flood findings | How the flood and water findings shape the drainage strategy and layout |
Official guidance Check long term flood riskFlood map for planningFlood zones in the NPPF, Annex F
On Kew Yard
Lowest river zone, high surface water
Kew Yard is in Flood Zone 1, the lowest river and sea category. Surface water risk is high in the search area.
AI insight
High surface-water risk is recorded within the search envelope, which does not prove it crosses the boundary. Where it does, it shapes the drainage strategy and layout, so on-site extent is unknown.
In the report
Flood findings go into the report with their sources
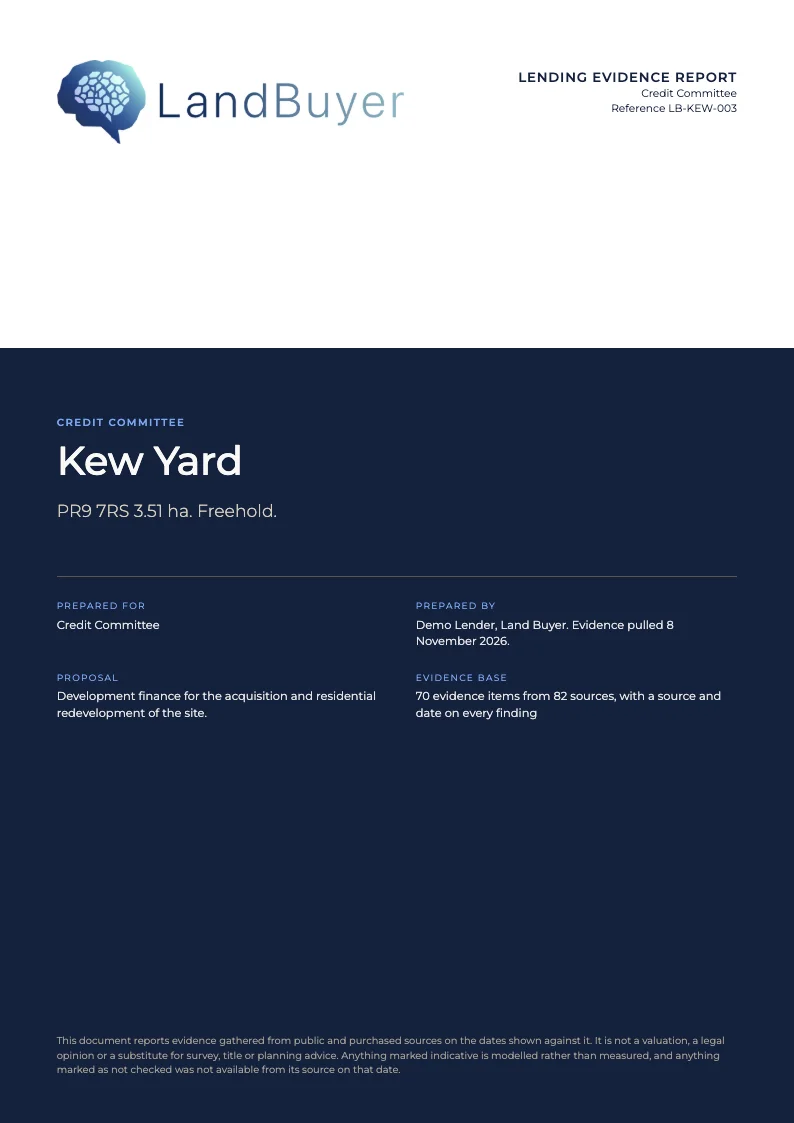
Tick Include in report on the flood zone and surface water cards. Both findings, the source and the retrieval date go into the lending evidence report that the credit committee reads.
FAQ
Flood zone and flood risk questions
Short answers to what land teams ask us before a demo.
How do I check the flood zone for a site?
LandBuyer AI returns the river and sea flood zone for the red line, with a link to the data source. Kew Yard is in Flood Zone 1, the lowest river and sea flood risk category.
What is the difference between river and surface water flood risk?
River and sea flood zones show flooding from rivers and the sea. Surface water risk shows flooding from heavy rain on the ground. They are separate datasets, so LandBuyer AI shows each on its own card.
Does a low flood zone mean no flood risk?
No. Flood Zone 1 covers river and sea only. Kew Yard shows high surface water risk in the search area, and the AI insight says its on-site extent decides the drainage strategy.
Where does the flood data come from?
The flood zone comes from flood maps for planning and surface water from the national surface water risk map. Main rivers come from the statutory main river map. Each card names its source.
What do flood zones 1, 2 and 3 mean?
Zone 1 has less than a 0.1% annual chance of river or sea flooding. Zone 2 is 0.1% to 1% from rivers, or 0.1% to 0.5% from the sea. Zone 3 is above those levels.
Keep exploring