
Checks
House price data for any site
See local prices, new build sales and competing schemes around the red line, each figure with its date.
In short
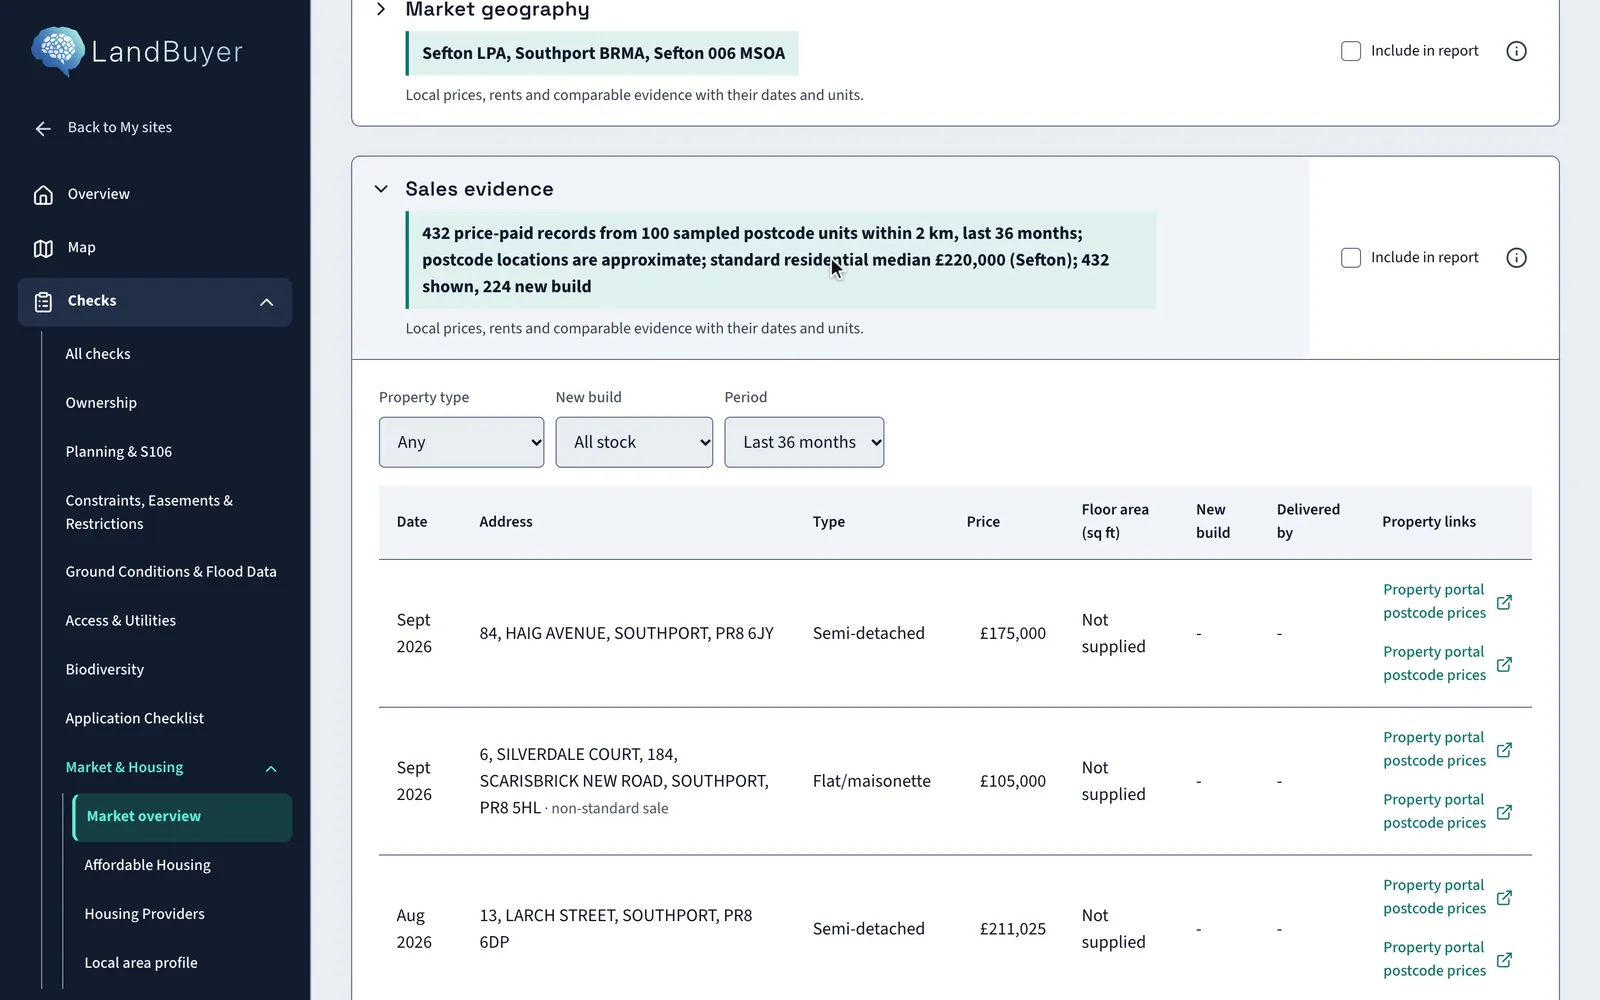
LandBuyer AI shows local average and neighbourhood median prices, price paid records within 2 km over 36 months, new build sales and private rents. It maps competing residential schemes by status. On Kew Yard it finds 432 sales records, 224 of them new build, and 23 residential schemes within 15 km.
What it covers
What our house price data covers
| Item | Source type | What you see |
|---|---|---|
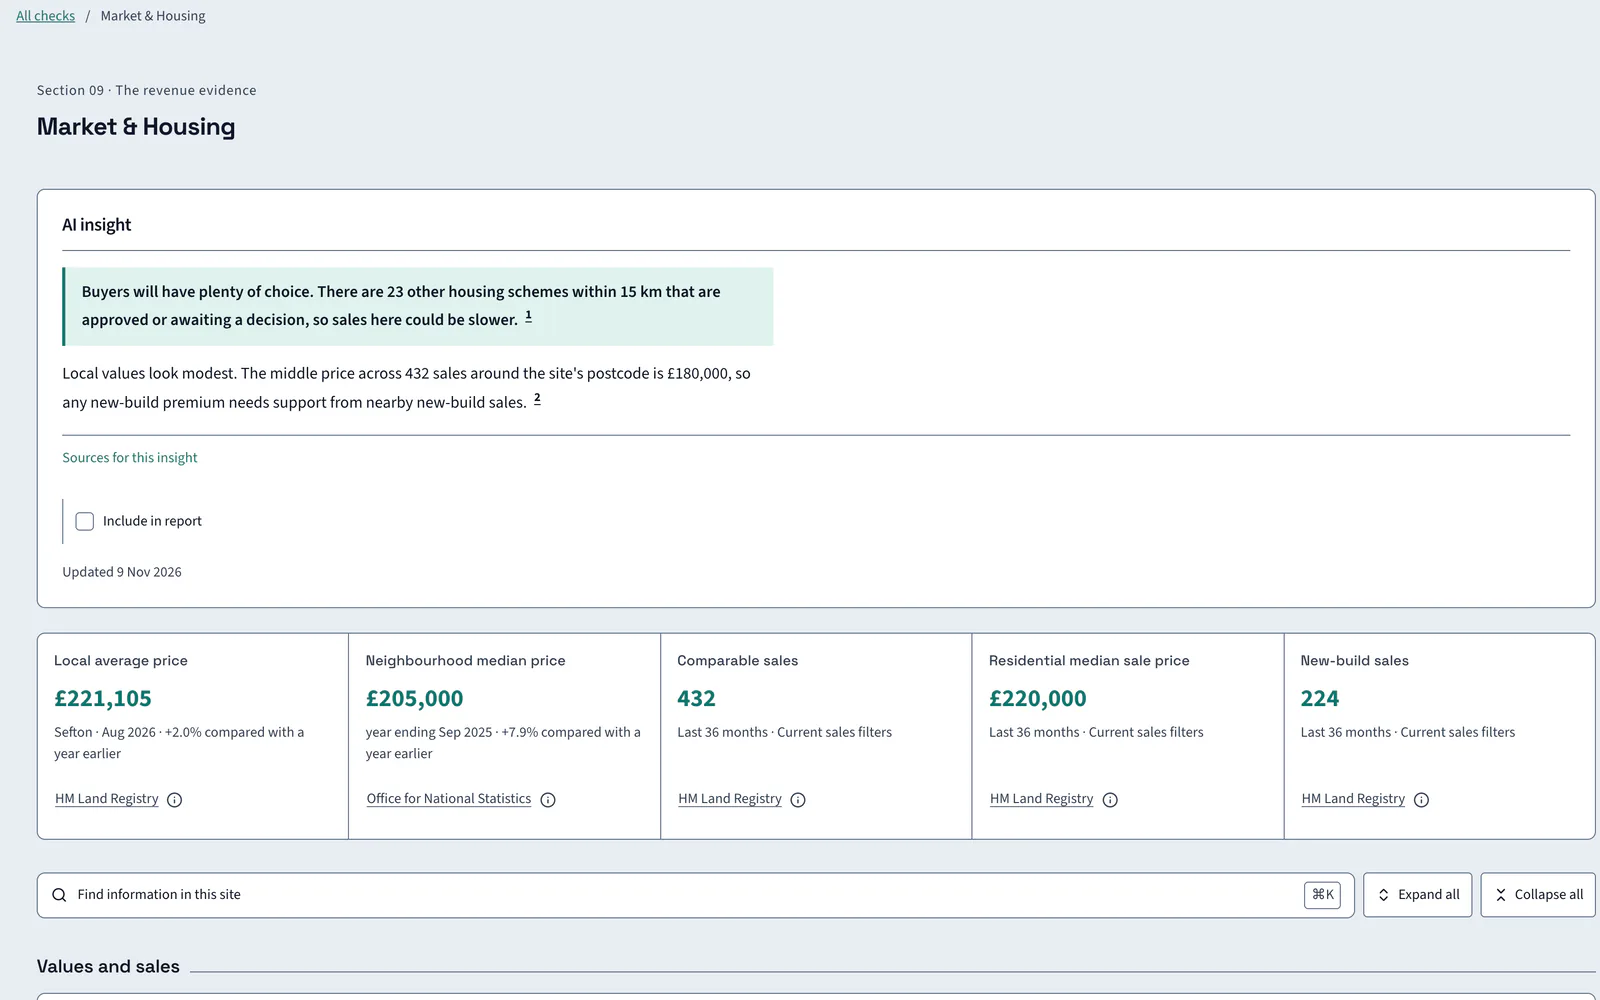
| Local average price | Official house price index | The authority's average price, the month and the change on a year earlier |
| Neighbourhood median price | Official neighbourhood statistics | The median price for the neighbourhood and its change over twelve months |
| Price paid records | Property sales register | Sales within 2 km over the last 36 months, with the standard residential median |
| New build sales | Property sales register | New build sales in the sample, and the streets they were delivered on |
| Comparable sales map | Price paid records and competing schemes | Sales and schemes on one map, against the median and the authority average |
| Rents | Private rent statistics | Average private rent and two bedroom rent for the area |
| Competing schemes | Planning application records | Residential schemes within 3 km and 15 km, approved and undecided, with the nearest distance |
| Registered provider stock | Regulator statistics | Providers holding social homes in the authority, and how many homes each holds |
| Market geography | Statistical geographies | The authority, housing market area and neighbourhood area that the figures use |
Official guidance HM Land Registry Price Paid DataUK House Price Index
On Kew Yard
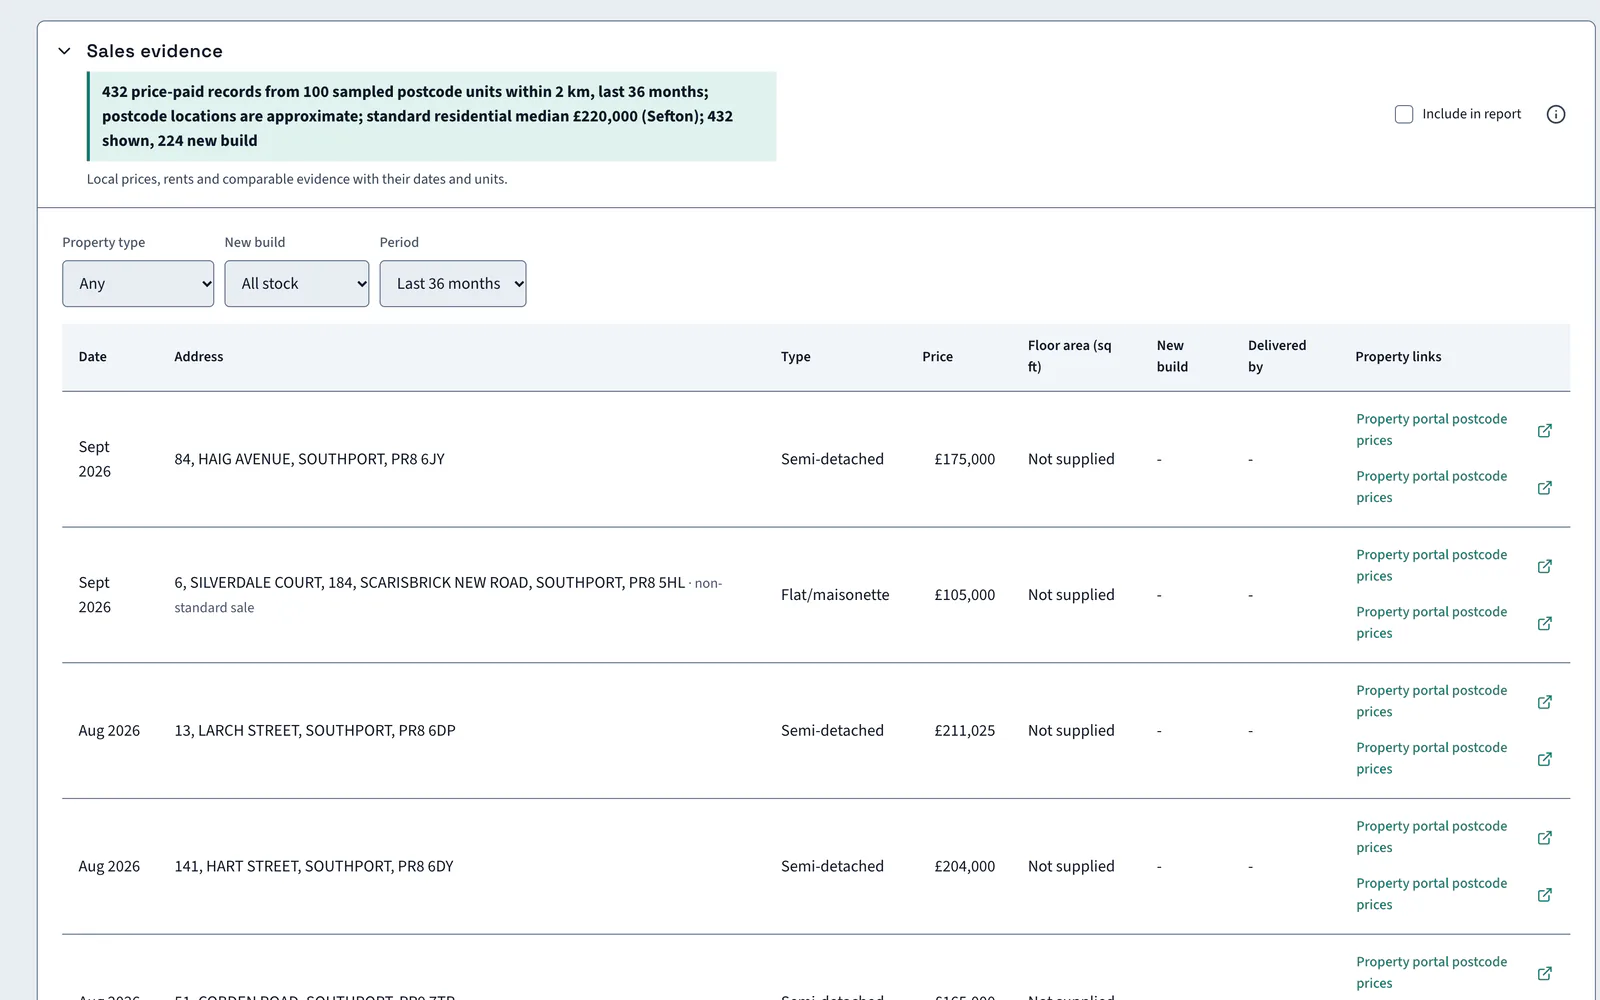
Sales evidence with its sample stated
The Kew Yard search finds 432 price paid records within 2 km over 36 months, 224 of them new build.
AI insight
The 15 km discovery search retained 23 residential schemes, 16 approved and 7 undecided. The undecided schemes would add competing supply if approved, so their outcomes matter to the delivery rate assumed for this site.
In the report
Market evidence goes into the report with dates
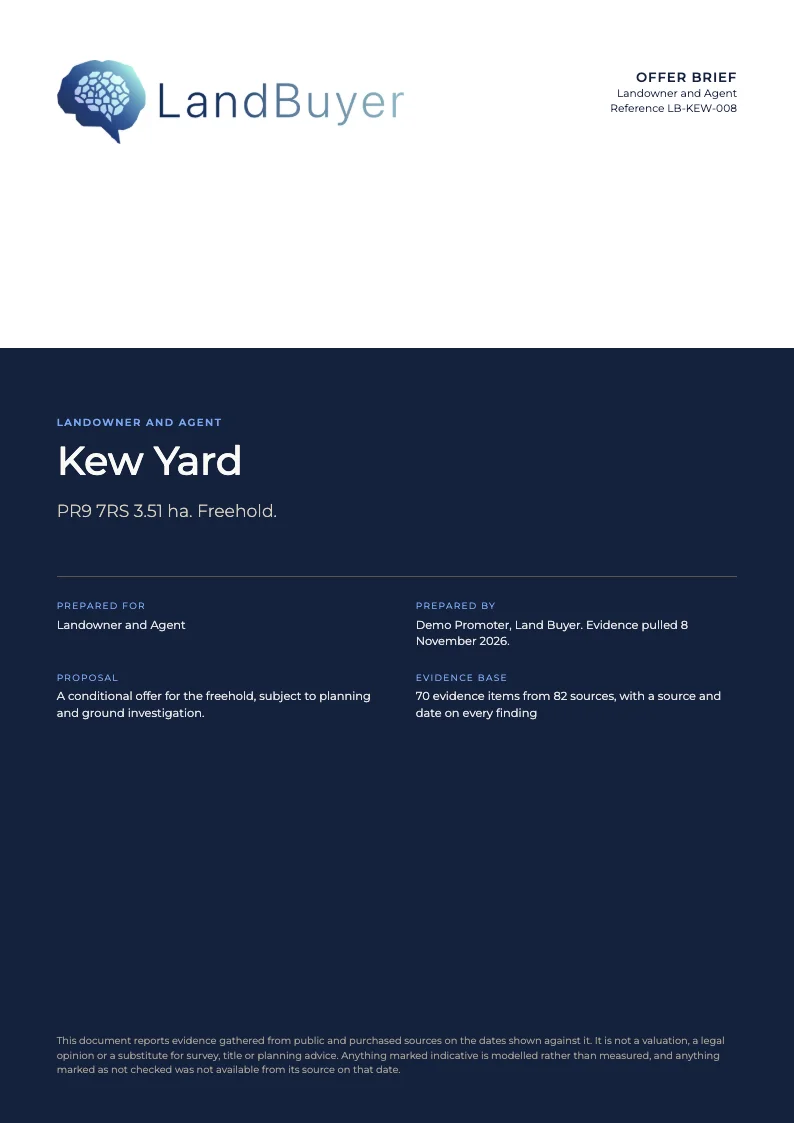
Tick Include in report on the sales evidence or competing supply cards. The prices, the sample size and the dates go into the offer brief, so the offer and its evidence sit together.
FAQ
House price data questions
Short answers to what land teams ask us before a demo.
What house price data does LandBuyer AI show?
Local average and neighbourhood median prices, price paid records within 2 km over 36 months, new build sales and private rents. Kew Yard shows 432 records, 224 of them new build.
Can I use it as land comps?
It gives sales evidence for the revenue side of an appraisal: prices, new build streets and competing schemes. It does not value the land. Land value comes from your own appraisal.
How current is the data?
Each figure shows its date. The Kew Yard local average is for August 2026 and the neighbourhood median is for the year ending September 2025. Sales evidence covers the last 36 months.
Does it show competing new build schemes?
Yes. It lists residential schemes within 15 km by status. Kew Yard has 23, 16 approved and 7 undecided, and 8 competing schemes sit within 3.0 km, the nearest 790 m away.
Keep exploring