
Features
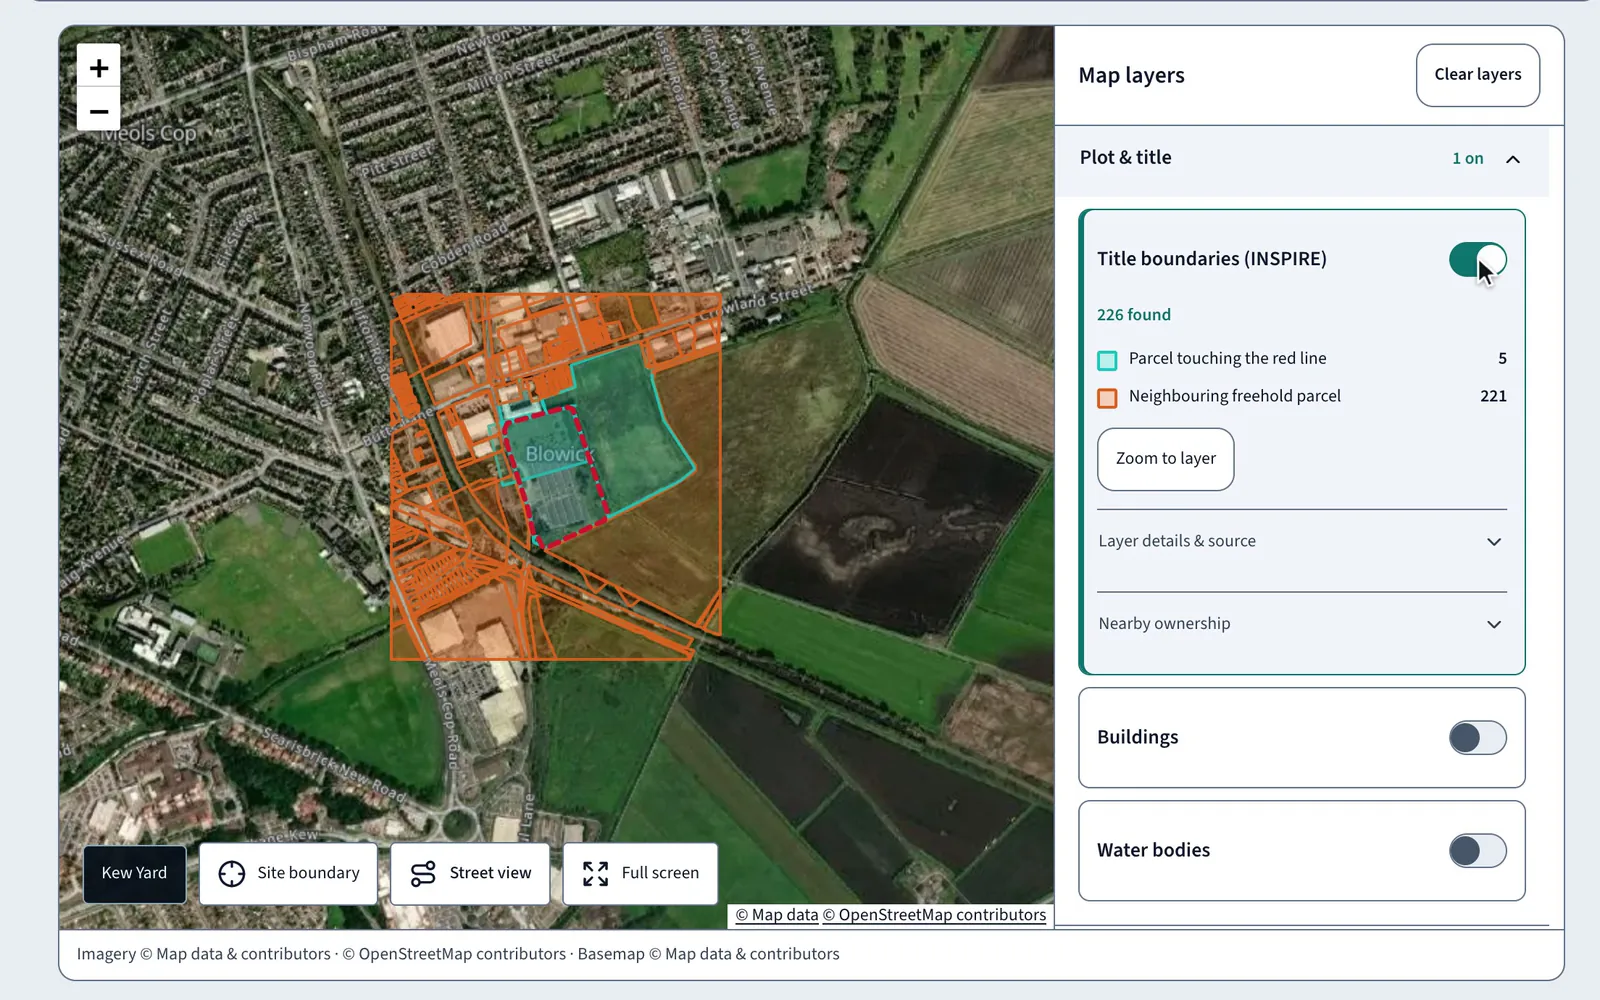
A land data map around your red line
Switch title, flood, planning and heritage layers on and off against the boundary you drew.
In short
The LandBuyer AI land data map puts title boundaries, flood zones, buildings, water bodies, planning and heritage layers around your red line. Each layer counts what it finds against the site, such as the parcels touching the boundary, and the checks behind it turn those layers into findings you can act on.
What it covers
What the land data map covers
| Item | Source type | What you see |
|---|---|---|
| Title boundaries | Title parcel boundaries | Parcels touching the red line and neighbouring freeholds, counted |
| Flood zones 2 and 3 | Flood maps for planning | Flood zone areas near the site, counted by zone |
| Buildings and water bodies | National mapping | Building footprints and water bodies around the boundary |
| Planning and heritage | Council and national designations | Designations and heritage assets near the site |
| Base maps | Satellite, street and historic maps | Satellite, roads and terrain, streets or historic mapping beneath the layers |
| Site boundary | Your red line | The boundary you drew or uploaded, with its area |
On Kew Yard
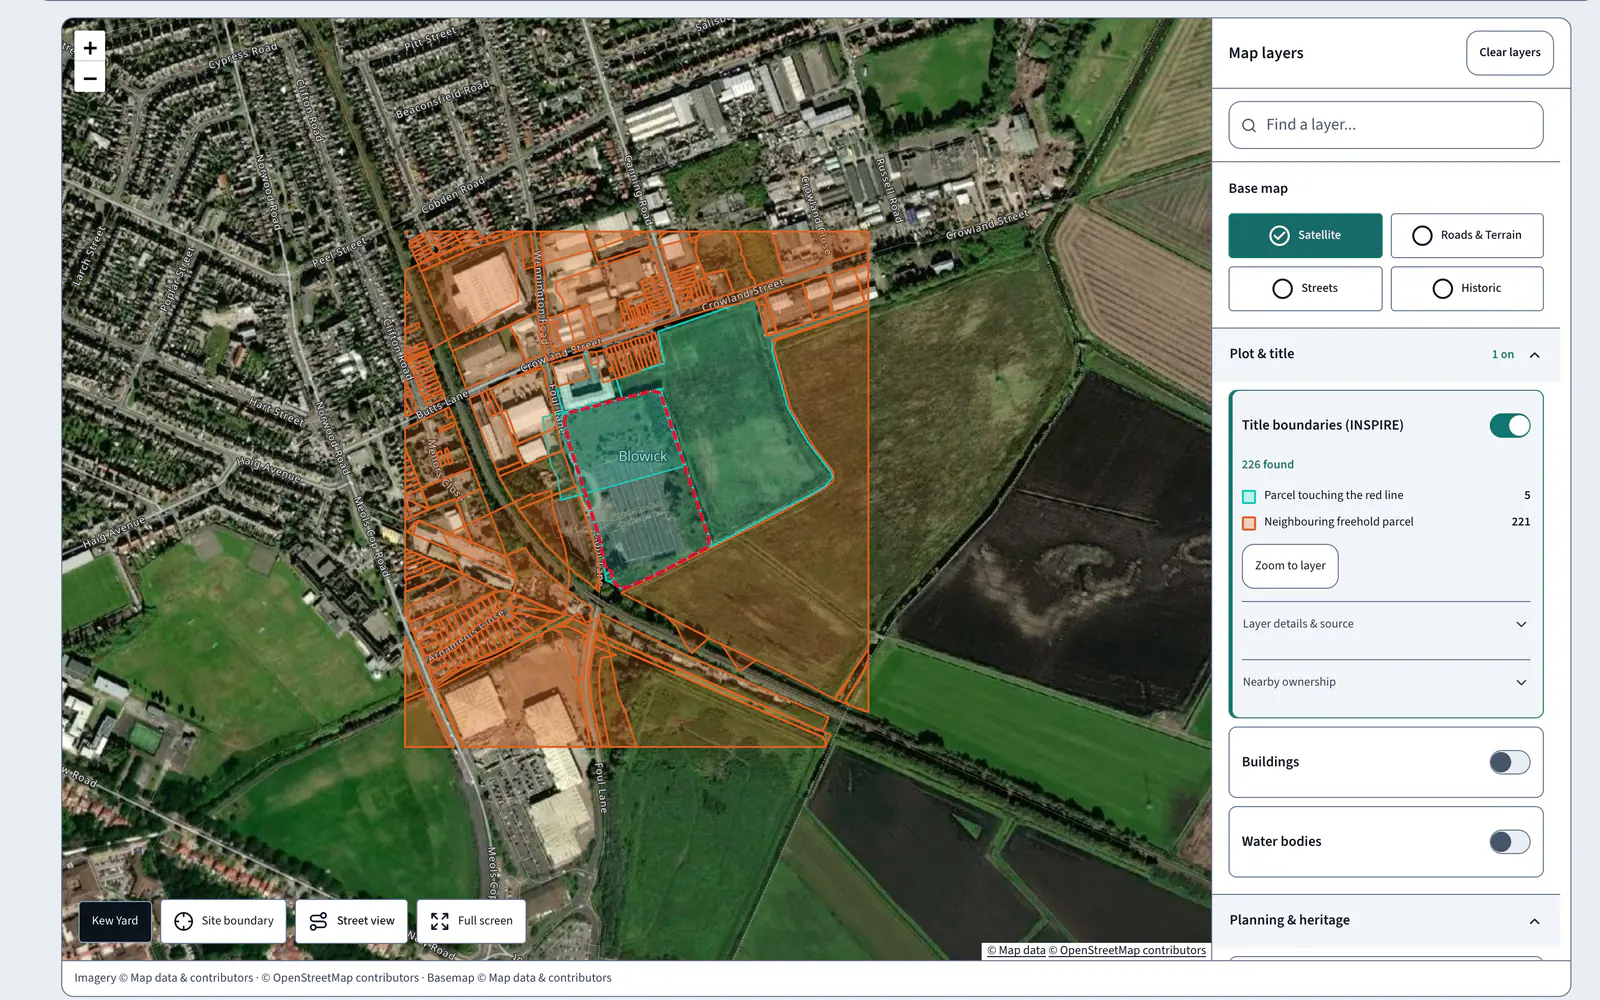
226 title parcels around a 3.51 ha site
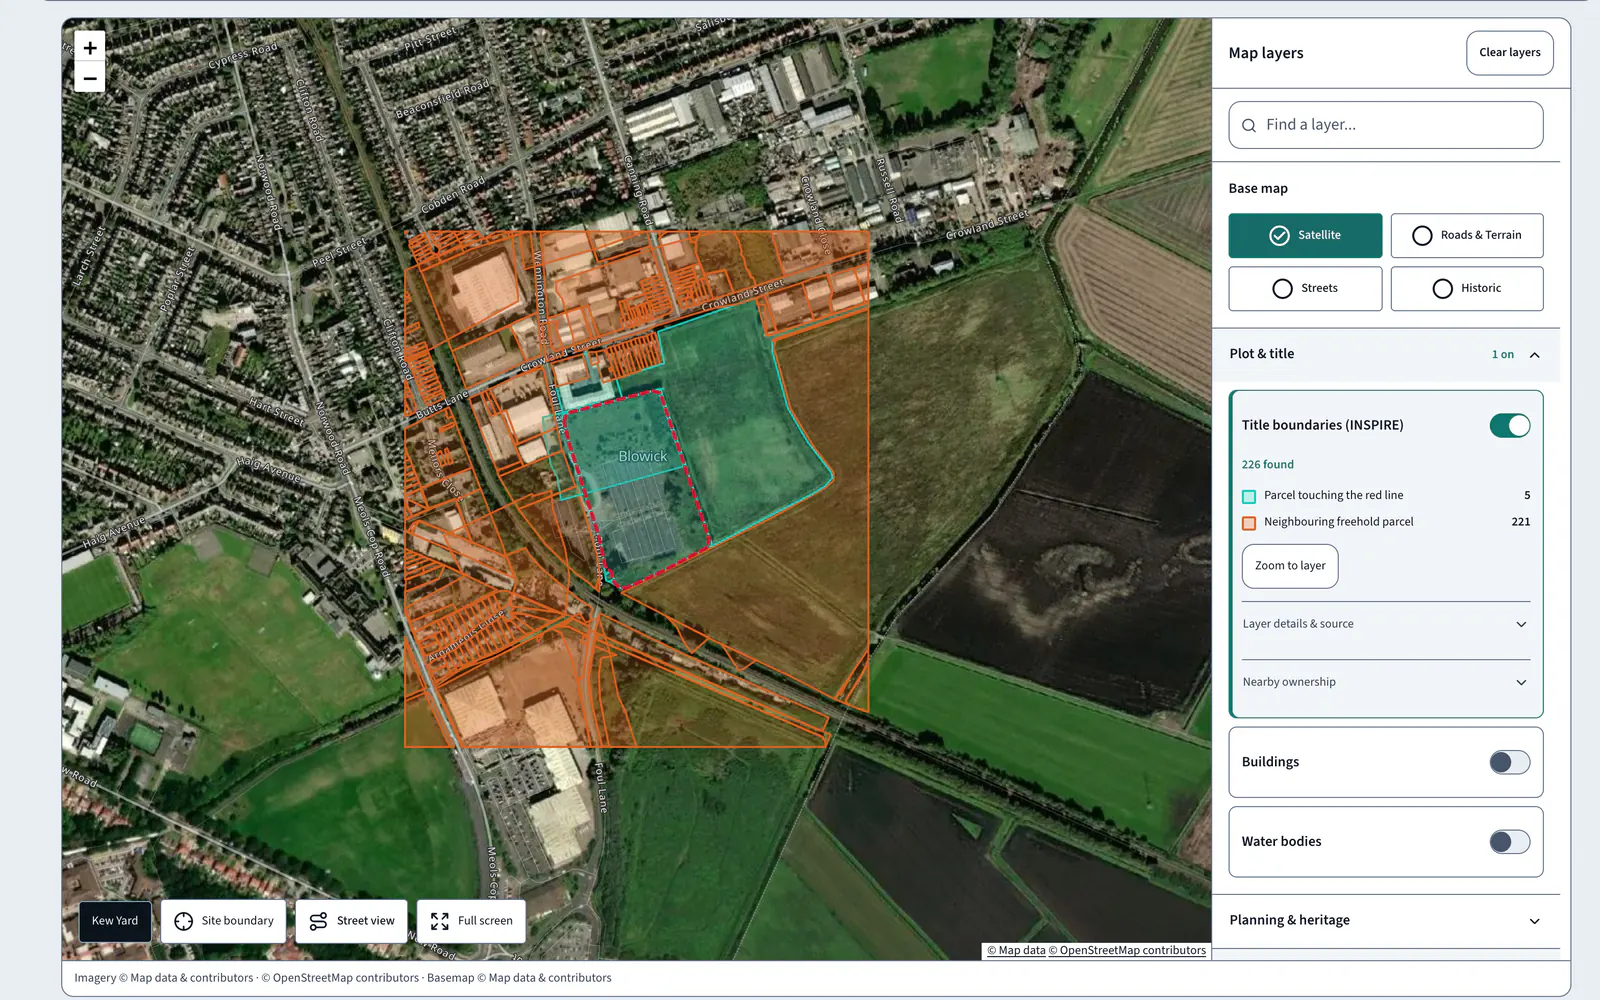
Switch on title boundaries at Kew Yard and the map finds 226 parcels: 5 touch the red line and 221 are neighbouring freeholds.
AI insight
A covenant bars dwellings, and affordable contributions apply only from 15 net homes; whether this scheme reaches that is unknown.
In the report
From the map to the findings
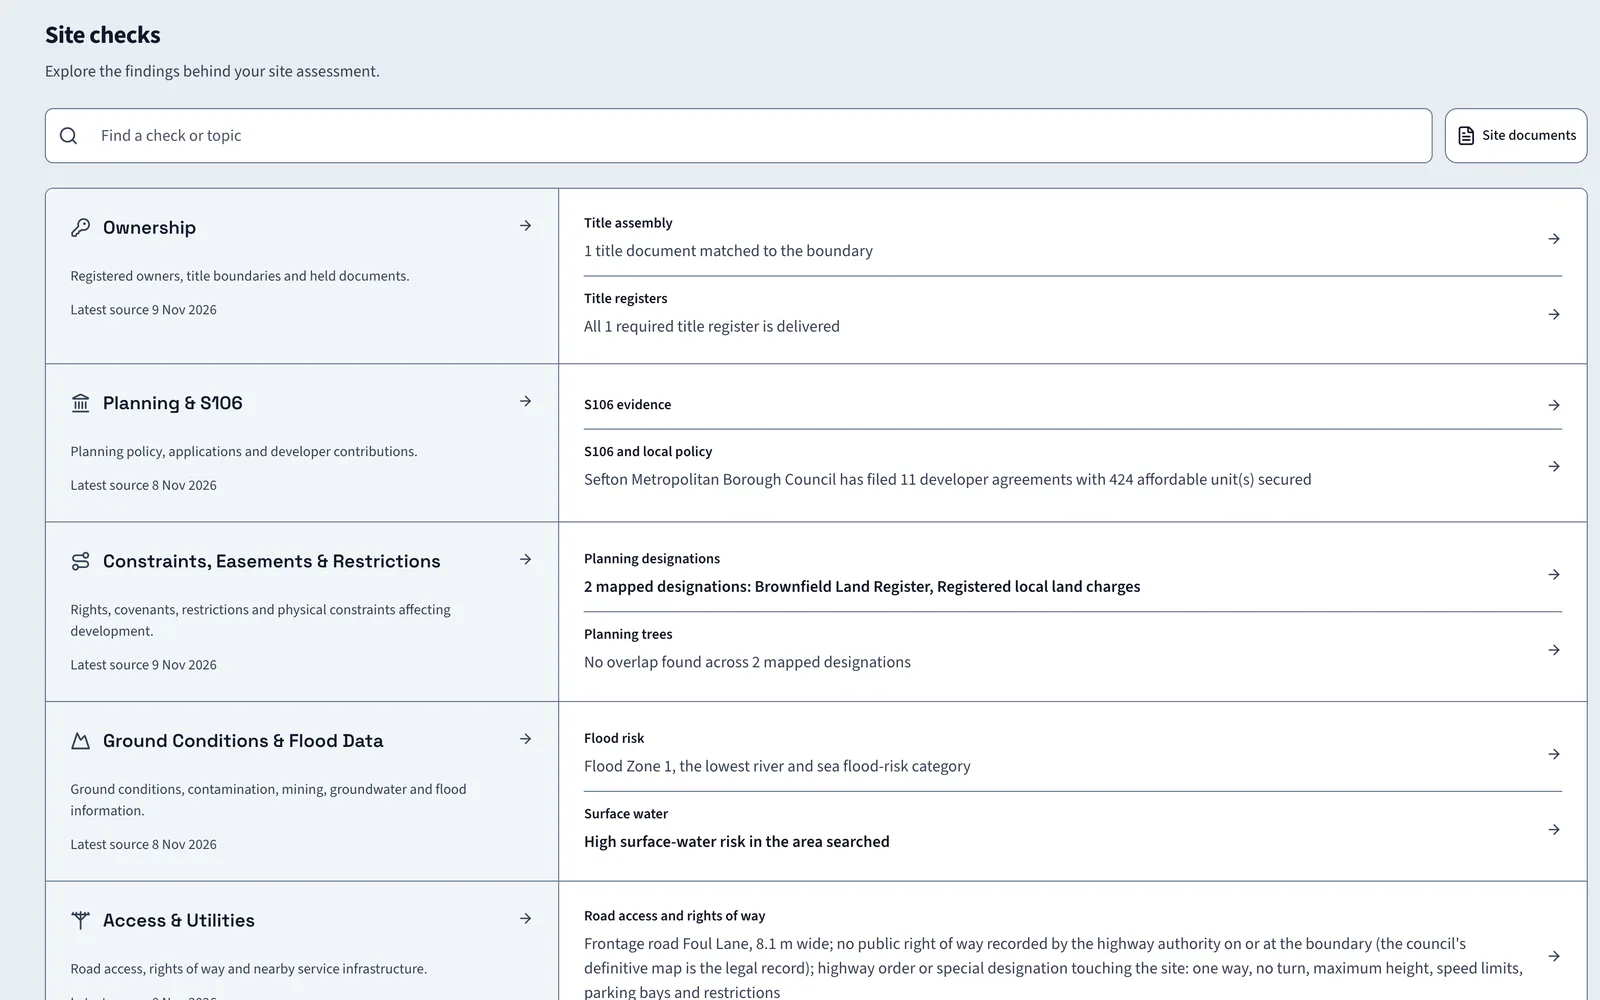
The map shows where things are. The checks behind it say what they mean for the site, and those findings go into the report with their sources and the date each was read.
FAQ
Land data map questions
Short answers to what land teams ask us before a demo.
What layers does the land data map show?
Title boundaries, buildings, water bodies, flood zones, surface water, main rivers, and planning and heritage designations, on satellite, roads and terrain, street or historic base maps.
Does it count what each layer finds?
Yes. Each layer shows a count against the site. On Kew Yard the title boundaries layer finds 226 parcels, 5 touching the red line.
Is LandBuyer AI just a map?
No. The map is one view. Every layer feeds a check with an AI insight, the indicative layout and the report your committee reads.
Can I look at the site at street level?
Yes. Open Street view from the map to look along the frontage, or switch to full screen to work through the layers at a larger size.
Keep exploring